Electrician vs. Plumber: Which Pays More?
The two trades sit in the same national wage band, so the real gap comes from licensing, union coverage, overtime and the state you work in.
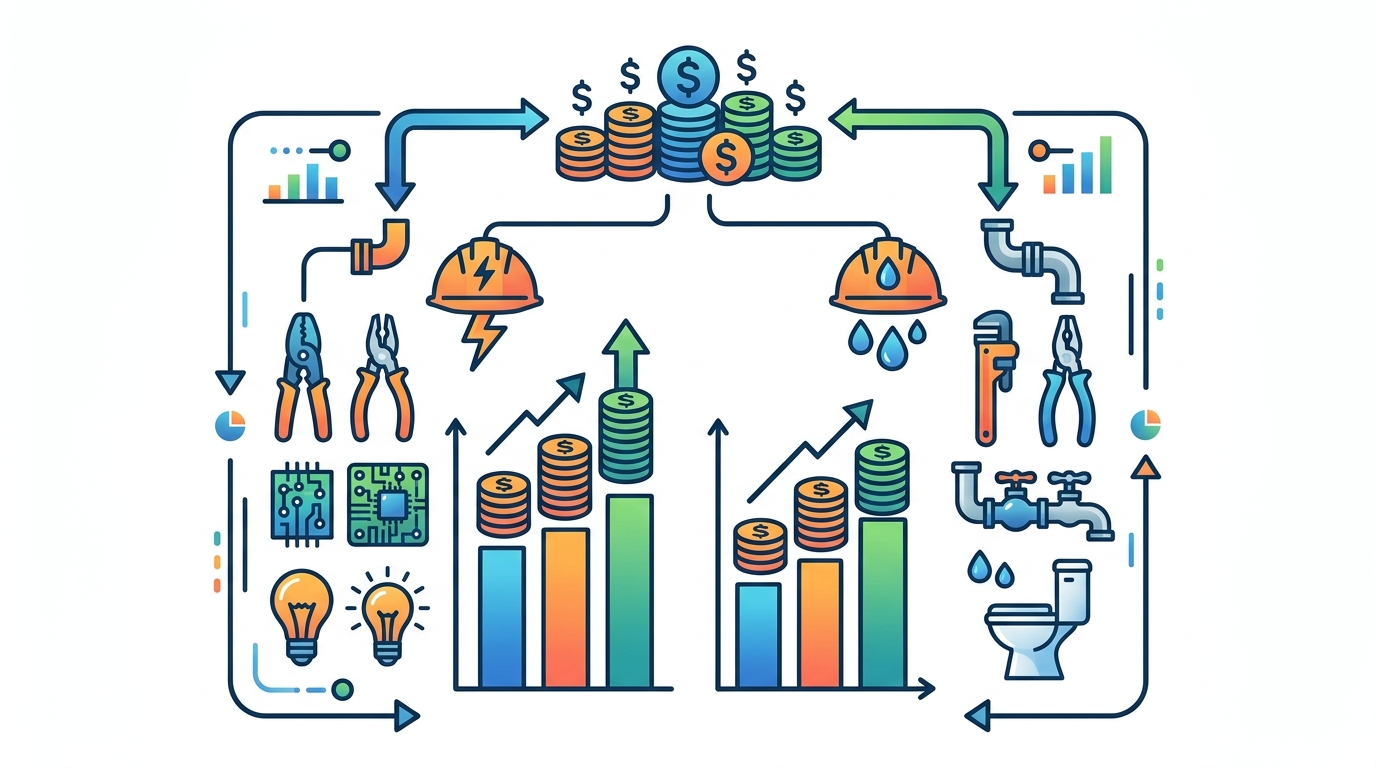
Nationally, electricians and plumbers are close enough that neither trade is the obvious winner on pay. Both are tracked by the federal government — electricians under SOC 47-2111, plumbers alongside pipefitters and steamfitters under 47-2152 — and both publish an entry-level (10th percentile), median, 75th and 90th percentile annual wage in the same BLS Occupational Employment and Wage Statistics (OEWS) tables, so you can read them side by side rather than guess.
What separates earnings is mostly structural: state licensing rules, whether the local market is covered by union contracts, how much overtime and service work is available, and the size of your employer. This guide shows you which figures to pull for each trade, which release they come from, and how to tell which one pays more where you actually live.
Pay Side by Side
Both occupations are reported on the same percentile structure, so a fair comparison means reading the same four numbers for each. Here is where each one lives.
| Comparison point | Electricians (SOC 47-2111) | Plumbers, pipefitters, steamfitters (47-2152) |
|---|---|---|
| Entry-level | 10th-percentile annual wage, May 2024 OEWS (salary-atlas.com, 2024-05); restated with 10th and 25th percentiles in the May 2025 release (wagedex.com, 2025-05) | Lowest published percentile annual wage in the ONET 2024 tables (ONET OnLine, 2024) and the May 2025 OEWS release (subcontractorhub.com, 2025-05) |
| Median | National median annual wage, May 2024 OEWS (salary-atlas.com, 2024-05), updated in May 2025 (wagedex.com, 2025-05); reported as 26% above the typical American worker's median (constructioncoverage.com, 2024) | National median annual wage, ONET 2024 (ONET OnLine, 2024), updated in the May 2025 OEWS release (subcontractorhub.com, 2025-05) |
| Mean (annual and hourly) | Mean annual wage and mean hourly wage, May 2024 OEWS (salary-atlas.com, 2024-05) and May 2025 OEWS (wagedex.com, 2025-05) | Mean annual and hourly wage in the same OEWS release for 47-2152 (subcontractorhub.com, 2025-05); state version in Hawaii's file (Hawaii DLIR, 2024-05) |
| Senior / top pay | 75th-percentile annual wage, May 2024 OEWS (salary-atlas.com, 2024-05); 90th-percentile annual wage for the highest-paid 10% (ablemkr.com, 2024-05) | 75th and 90th percentile annual wages in the same OEWS tables; Hawaii's state estimates show the top of that state's range (Hawaii DLIR, 2024-05) |
| Typical path to top pay | Licensed journeyman to master electrician, then foreman, estimator or contractor; industrial and utility work and IBEW-covered contracts cluster at the top (majormatch.us) | Journeyman to master plumber, then service manager or contractor; pipefitting and steamfitting work, which shares the 47-2152 code, carries much of the upper range (O*NET OnLine, 2024) |
Two things to watch when you read these tables. First, every figure is published as both an annual and an hourly estimate — don't compare an hourly plumber number to an annual electrician number. Second, 47-2152 bundles plumbers with pipefitters and steamfitters, so the plumber-only picture in your area may sit below or above the combined figure depending on how much industrial pipe work your region has.
Electrician demand is published separately: BLS projects employment growth and a specific number of average annual openings for the trade over 2024–2034 (ablemkr.com), with the total job count and projected openings also summarised from the Occupational Outlook Handbook (tradecolleges.org). ONET publishes the equivalent projected openings figure for plumbers, pipefitters and steamfitters (ONET OnLine, 2024). Pull both before you commit — openings volume drives how quickly you move off apprentice rates.
Why the Gap Exists
The gap, where there is one, is not about one trade mattering more. It comes from four concrete things.
Licensing. Both trades are licensed state by state, and in most states you cannot work unsupervised without logging apprenticeship hours and passing an exam. That requirement is what keeps entry pay off the floor — it also means your first years are paid as a percentage of the journeyman rate rather than at the median. The number of hours and the exam content differ between electrical and plumbing boards in the same state, so check your state licensing board for both trades before assuming the timelines match.
Union coverage. High-wage states for electricians are described as typically reflecting strong IBEW union contracts (majormatch.us), and that shows up in the state files: Oregon's average electrician wage runs above the national electrician median (majormatch.us). Plumbing and pipefitting have their own agreements, and coverage density varies by metro, not by trade alone. Where a trade is heavily covered locally, scheduled rate steps replace individually negotiated raises.
Demand and the measurable premium. Electricians' median wage is reported at 26% more than the typical American worker's (constructioncoverage.com, 2024) — that is the clearest quantified effect either trade publishes, and it reflects steady demand backed by BLS projected growth and average annual openings for 2024–2034 (ablemkr.com; tradecolleges.org).
Employer type and setting. Residential service shops, commercial contractors, industrial plants and utilities pay differently within each trade, and the spread between the 10th and 90th percentile annual wages for electricians (salary-atlas.com, 2024-05; ablemkr.com, 2024-05) is driven mainly by that mix plus years of experience. The same two variables — employer setting and experience — explain most of the spread in the plumber, pipefitter and steamfitter figures (O*NET OnLine, 2024). State is the third: Hawaii's OEWS estimates for 47-2152 (Hawaii DLIR, 2024-05) sit far from a low-cost state's estimates for the same work.
Which One Fits Your Priorities
- Fastest entry pay. Compare the electrician 10th-percentile annual wage (salary-atlas.com, 2024-05) with the lowest published percentile for plumbers, pipefitters and steamfitters (O*NET OnLine, 2024) in your own state file — whichever is higher locally is your answer, and in many states the two are within a few thousand dollars a year.
- Highest ceiling. Electricians publish a 90th-percentile annual wage for the top-earning 10% (ablemkr.com, 2024-05), typically reached as a master electrician, foreman or contractor in industrial or utility work. For 47-2152, the top end is carried largely by pipefitters and steamfitters rather than residential plumbers (O*NET OnLine, 2024).
- Most predictable raises. Union-covered work in either trade, because rate steps are scheduled. High-wage electrician states are described as typically reflecting strong IBEW contracts (majormatch.us); check local plumbing and pipefitting agreement coverage for the equivalent.
- Best in a specific state. Oregon favours electricians on the published average wage versus the national electrician median (majormatch.us). Hawaii's state estimates for plumbers, pipefitters and steamfitters (Hawaii DLIR, 2024-05) show how far a single state can sit from the national figure — run the same check for both occupation codes wherever you live.
- Most openings to enter through. BLS publishes projected growth and average annual openings for electricians over 2024–2034 (ablemkr.com; tradecolleges.org) and ONET publishes projected openings for plumbers, pipefitters and steamfitters (ONET OnLine, 2024). More openings usually means a shorter wait for an apprenticeship slot.
Frequently asked questions
Does one trade clearly pay more nationally?
Not clearly. Electricians' national median annual wage is published in the May 2024 and May 2025 OEWS releases (salary-atlas.com, 2024-05; wagedex.com, 2025-05) and is reported as 26% above the typical American worker's median (constructioncoverage.com, 2024). The plumber, pipefitter and steamfitter median is published in the O*NET 2024 tables (O*NET OnLine, 2024) and updated in the May 2025 OEWS release (subcontractorhub.com, 2025-05). Read both medians from the same release year and compare them in the same units — annual to annual.
Which has the higher top end?
For electricians, the top is the 90th-percentile annual wage reported for the highest-earning 10% (ablemkr.com, 2024-05), usually reached by master electricians, foremen and contractors in industrial and utility work. For 47-2152, the comparable 90th-percentile annual figure appears in the same OEWS tables, and much of it comes from pipefitting and steamfitting rather than residential plumbing (O*NET OnLine, 2024). Compare those two percentiles directly.
Does the answer change by state?
Yes. Oregon's average electrician wage sits above the national electrician median (majormatch.us), while Hawaii's OEWS estimates for plumbers, pipefitters and steamfitters (Hawaii DLIR, 2024-05) show a state figure well away from the national one. Pull both occupation codes — 47-2111 and 47-2152 — from your own state's OEWS file, since a state can favour one trade and its neighbour the other.
Which trade has more openings to get started in?
BLS publishes projected employment growth and average annual openings for electricians over 2024–2034 (ablemkr.com), with the total job count and openings also summarised from the Occupational Outlook Handbook (tradecolleges.org). O*NET publishes projected job openings for plumbers, pipefitters and steamfitters (O*NET OnLine, 2024). Check both numbers for your state, since apprenticeship availability tracks local openings more than national totals.
Sources
- salary-atlas.com — Electrician Salary — Median, Range & 6-Year Trend (2024-05)
- ablemkr.com — The State of Skilled Labor in Electrical 2026 (2024-05)

Written by
Yuki covers the broader shifts in how people work: shrinking industries, growing ones, the policies that quietly decide who gets steady income. She tends to start stories with a worker's own account before zooming out.